The Taylor Rule and Sector Views
Given the current macroeconomic environment, where the most significant topics include discussions on inflation, policy rates, real GDP (rGDP), and the Fed Funds Rate, we thought it would be valuable to visit the relationship that connects all these variables together. The Taylor Rule is a way to utilize associations based on both historical data and economic expectations to estimate what the policy rate should be given the levels of these specific variables.
The Taylor Rule says the target nominal policy rate (i) should be dependent on the level of real neutral rates (rn), expected inflation (πe), half of the difference between expected real GDP growth (Ye) and trend real GDP growth (Yt), and half the difference between expected inflation (πe) and target inflation (πt). If expected inflation is above target inflation, then the rule says that The Federal Reserve (The Fed) should raise rates. If expected rGDP growth is above trend rGDP growth, then Fed Policy Rates should also rise as well. This way the economy can be cooled with higher rates when it’s running too hot and heated with lower rates when running cold. The full formula is below.

Inflation
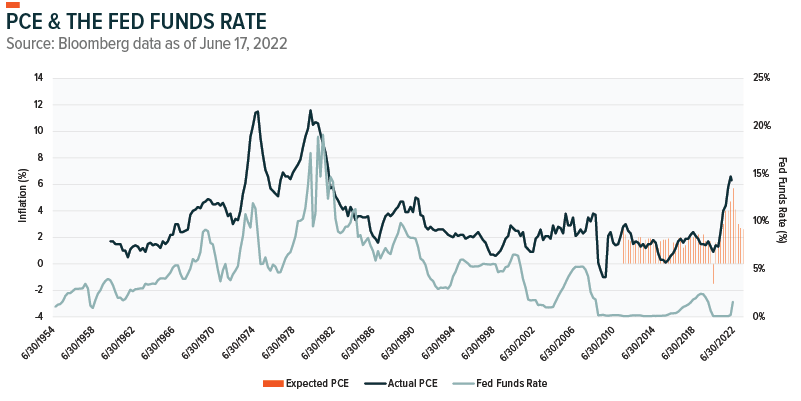
Inflation, in this case, would be best measured through Personal Consumption Expenditure (PCE) Index, since this is the same figure that The Fed uses. The main difference between PCE and Consumer Price Index (CPI) is that CPI data is sourced from consumers, while PCE data is sourced from businesses.1 And that PCE measures goods and services bought by all households and non-profits, while CPI only accounts for urban households. CPI can also be victim to wide price volatility, while PCE has a smoothing effect which lowers volatility. Given the positive relationship between inflation and the policy rate, if expected inflation rises, then the rule dictates that Fed Policy Rates should rise as well.
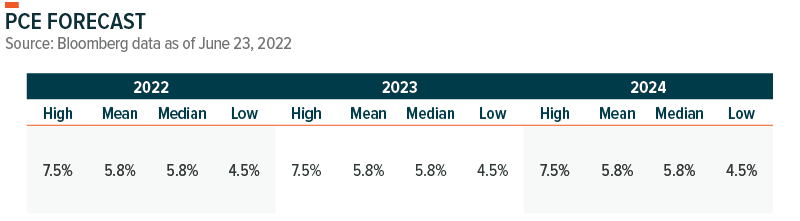
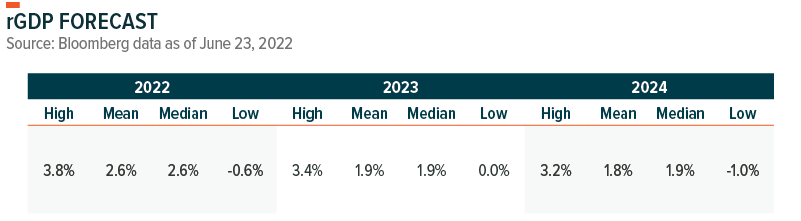
The Fed has indicated that the target inflation rate for the economy should be around 2%2. So, this could fit with the target inflation variable (πt). For expectations, they’re subjective, if basing off The Fed forecast then it would be 5.2% for 2022, 2.6% for 2023, and 2.2% for 2024.3 If basing off private institutions, then this variable can vary as seen below.
GDP
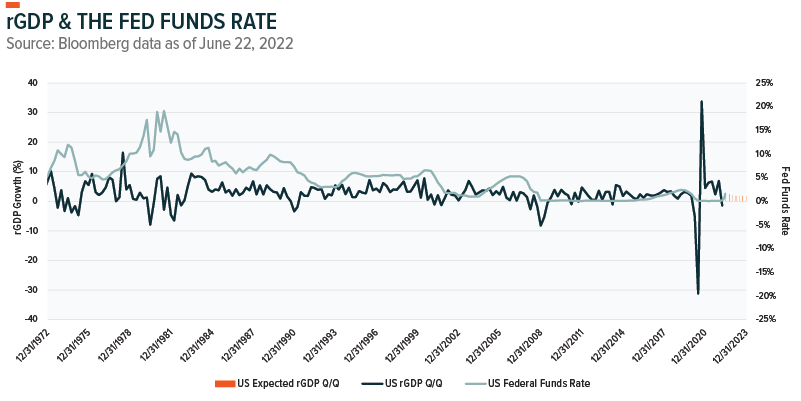
Real GDP is measured by removing the effects of inflation from nominal GDP. The relationship between rGDP and Fed Policy Rates is positive as well. If expected growth rises above trend growth, then the Taylor rule says that rates should rise as well. Higher rates tend to cool demand, and through this equilibrium process higher policy rates are used so the economy doesn’t overheat. Historically, average rGDP growth since 1973 has been about 2.7%4, greater than The Fed’s projections of 1.7% for 2022, 1.7% for 2023, and 1.9% for 2024. The Fed projects that long run change in real GDP is expected to be about 1.8%.5
For the Taylor Rule, inputs for both expected rGDP and trend rGDP can vary. Potential substitutes for the long term Yt could be the long run rGDP estimate from The Fed of 1.8%, which would maintain consistency since the Fed Funds Rate is a product of Federal Reserve expectations. Another option would be the empirical figure of 2.7% from 30 years of historical data. The drawback would be that tomorrow’s economy is different than yesterdays and the past doesn’t dictate the future. While the much more subjective shorter term Ye, could either be based on The Fed’s near-term projections or current private institution expectations of what rGDP could be. Similar to expected PCE, this number also varies depending on institution.
The real neutral rate (rn) is what the assumed short-term rate should be if inflation and output influences were removed from the economy.6 This rate can be determined by looking at the longer run nominal Federal Funds Rate projections. From the June FOMC meeting, the median for this is set at 2.5%, up 10bps from the March meeting. If backing out long term inflation, which is set at 2.0%, the real neutral rate can be deduced to be 0.5%.
Bringing It Together
Bringing together all the above, we now have variables to estimate what the Fed Policy Rate could be in 2022, 2023, and 2024. Variables for the real neutral rate, target inflation, and trend rGDP growth can remain static when forecasting Fed Funds rates since these are long term estimates provided by The Fed. This leaves expected rGDP growth and expected inflation as the dynamic variables where investors and institutions can apply their individual outlooks on the market.

The scenarios below outline what the Taylor Rule says the Fed Policy Rate should be under certain rGDP and Inflation Expectations.
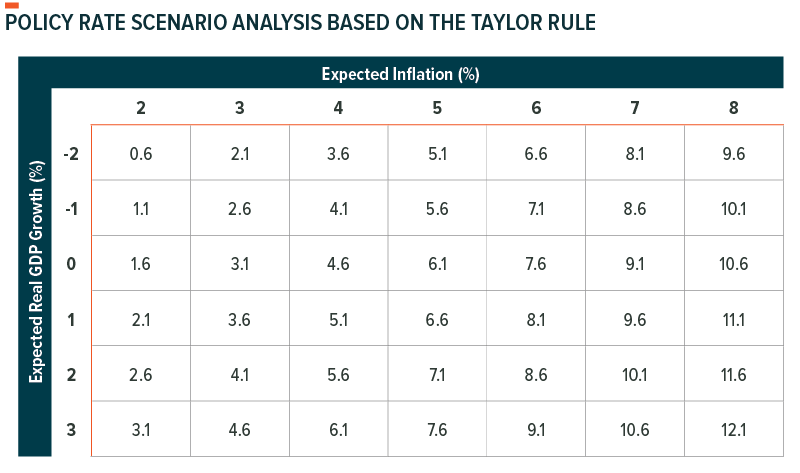
Although the Taylor Rule is a widely used metric to assess the potential level of Fed Policy Rates, it doesn’t account for other factors. One of which is the unemployment rate, which plays a large role in The Fed’s decision on how to position their rates. By using this framework investors can also back into what The Fed could be assigning as their expected inflation and expected GDP for each year given their trajectory of terminal rates for that given year. With higher policy rates, equity valuations are discounted at a higher premium, causing a revaluation that affects growthier sectors more than value.
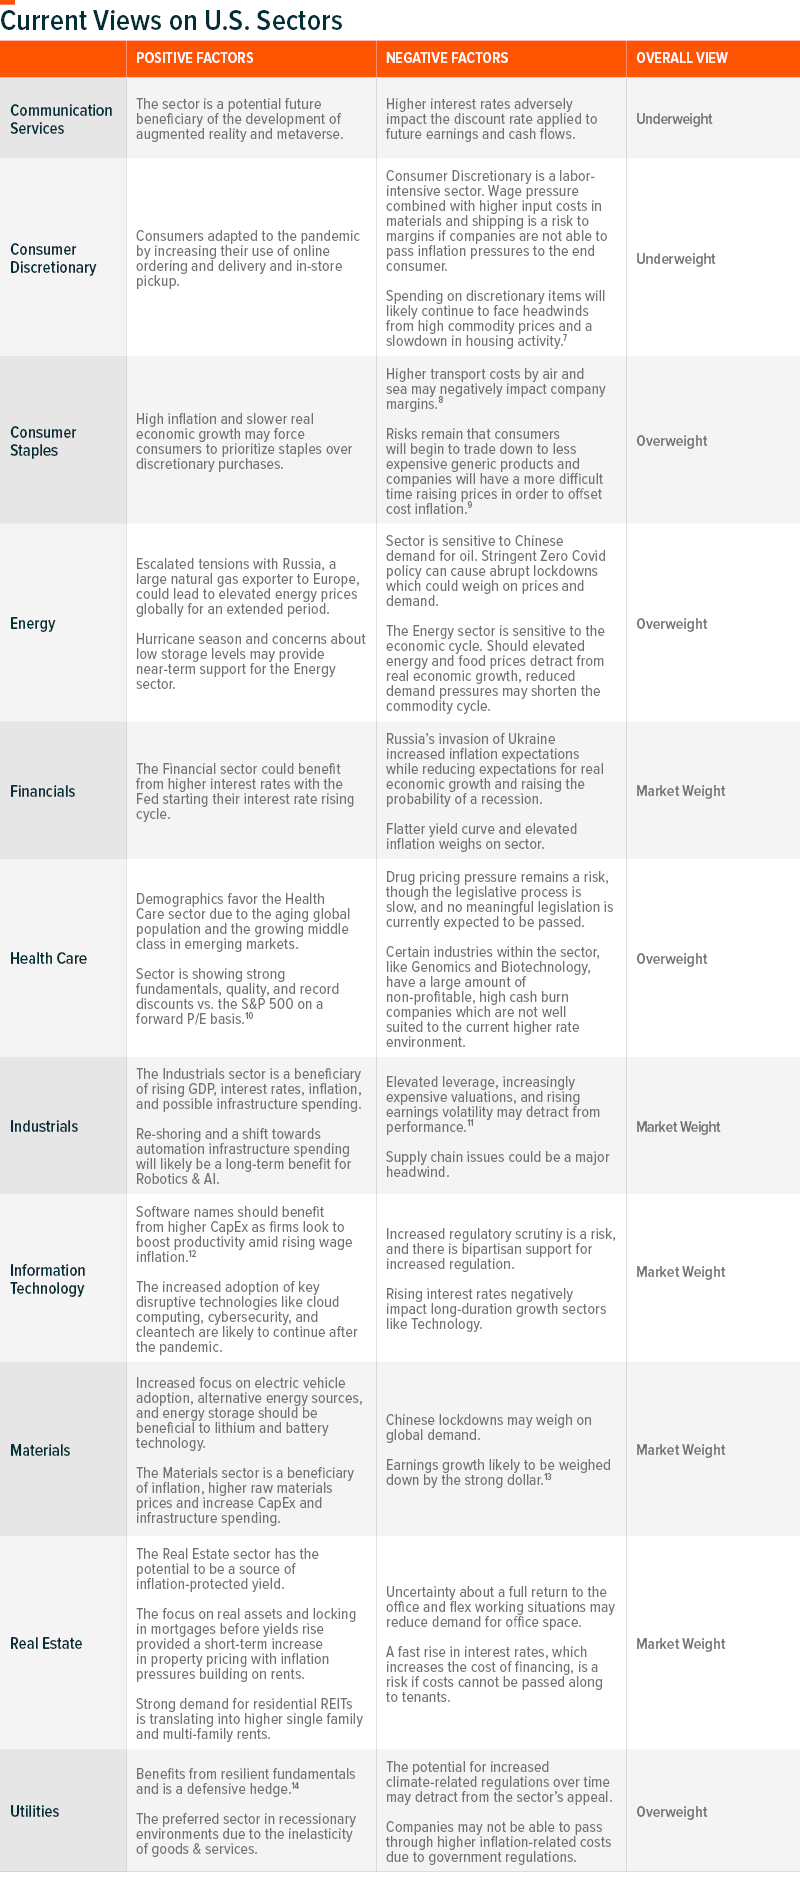
Our sector views table provides more detail on sector positioning and the current tailwinds and headwinds for each sector.