Exchange-Listed Options and Their Potential Impacts on Market Volatility
The following is the final part in a 3-part blog series on the market making landscape for exchange traded options. This part discusses potential option market impacts on market volatility and considerations when analyzing the growth in ETF usage of such contract types. Part 1 discussed the role of liquidity providers when it comes to making a market in listed options. Part 2 explained additional options risks that options market makers will need to consider when enacting hedging trades.
Options have remained an attractive avenue for investors seeking to diversify their portfolios away from traditional asset classes. Accessing the exchange traded options markets, investors can implement their own unique strategies to either offset risk, generate income or enhance performance. Fueling the engine that drives accessibility to these public derivatives markets are large institutions that play an essential role as everyday liquidity providers.
Key Takeaways
- Gamma and delta hedging options trades from market makers have the potential to influence movements in the assets underpinning their options. This influence is dependent on supply and demand dynamics within the underlying asset.
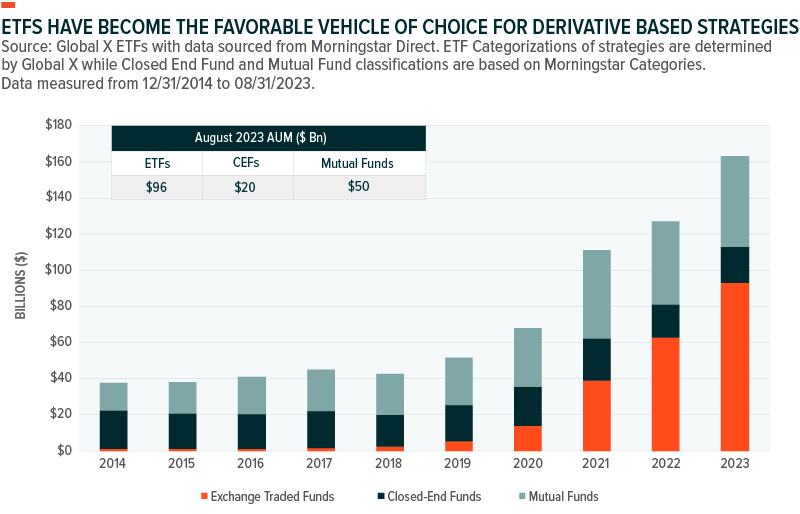
- Demand for options strategies in a managed investment vehicle has risen significantly over the last few years. Noticeable ETF demand for these types of strategies highlights the important role market makers play in maintaining option market efficiencies.
- Although growing at a fast pace, the ETF industry’s footprint on implied volatility remains muted. More recently, the options market is signaling other potential causes of declining volatility and recent bullish market sentiment.
Market Maker Gamma Exposure Is One Component of Potential Movements in Volatility
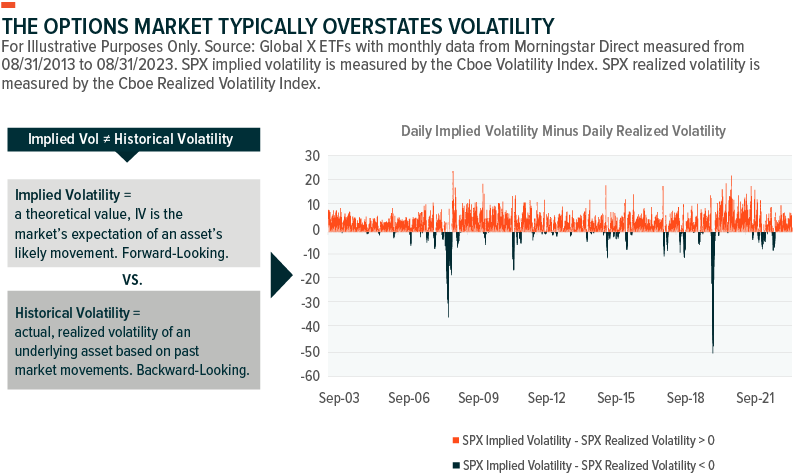
The Cboe Volatility Index (VIX), a widely quoted implied volatility index, measures the market’s expectations of U.S. equity market volatility over the next 30 days. Typically used as a “fear gauge” for market participants, investors may also utilize this index as a proxy of options valuations. Implied volatility is typically overstated by the options market, relative to historical volatility, particularly since options markets are pricing in the potential for a left tail movement in the underlying asset.
Implied volatility calculations take the total demand of options into account, regardless of the investor or institution purchasing or selling the respective contracts. These participants and market maker trading activities alike are expected to play a natural role in implied volatility index calculations, as a result. As options volume continues to rise from retail and institutional investors, option liquidity providers have to hedge their exposures immediately to limit their market risks.
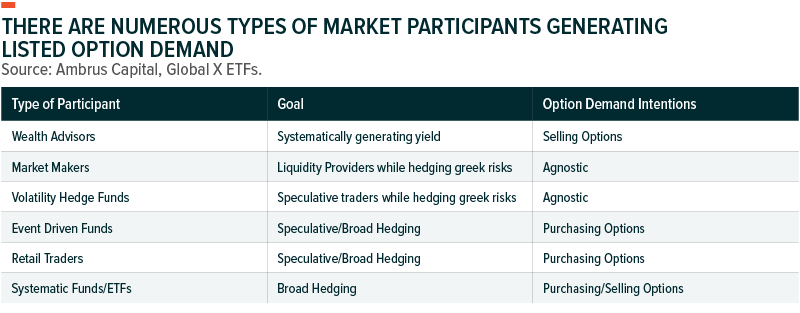
It’s generally assumed that market makers and dealers are typically sellers of puts and buyers of calls when hedging their books. This may be the case due to secular retail and asset manager demand for purchasing puts as a means to provide portfolio protection while selling covered calls is a popular means of income generation amongst this same group of investors.
Amidst these allocator flows, market makers are standing by to provide liquidity by taking the opposite side of these trades to gamma and delta hedge their books. It’s these continuous options flows that will determine market maker’s gamma exposure, thus impacting the directionality of their gamma and delta hedging trades upon movements in the underlying.
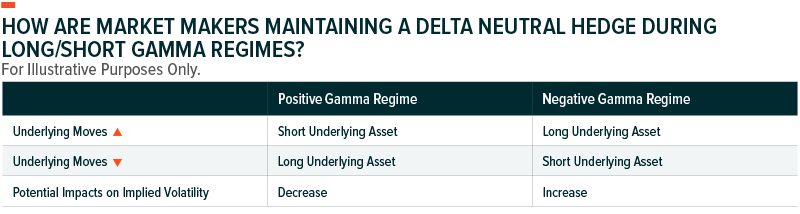
In times when market maker gamma exposure is positive, delta hedging flows are expected to move inverse to the direction of the underlying asset and may play a role in dampening volatility. In a short gamma regime, option market makers are taking the opposite approach and are expected to buy and sell the underlying in the same direction to the movements in the underlying asset. This has the potential to create feedback loops that may increase volatility while the former is expected to assist in mitigating volatility.
Note that the level of impact from these options trading activities will also depend on the level of buying and selling from other market participants who are purchasing an option’s underlying asset for their portfolio as a part of their strategies or tactical allocations. Therefore, options market demand may outweigh these allocators, and vice versa.

Providing an example of a positive gamma regime, it’s important to notate that the above is a snapshot and gamma exposure is expected to change continuously throughout the trading day. With $19B in net gamma exposure, at 1:26PM EST on 09/01/2023, the S&P 500 index options market was in a positive gamma regime that would have expected to see volatility dampening flows from dealers. Therefore, for every 1% move up in SPX, option dealers would have been expected to be net sellers of the underlying index and vice versa. This may increase the difficulty for the underpinned asset to increase further as SPX’s spot price approaches contract strikes with high open interest, thus high dealer gamma exposure.
Demand between the aforementioned participants is expected to increase as listed option trading strategies continue to become more mainstream within the capital markets. Institutions and retail investors alike have differing reasons for their options trading participation. Whether that’d be to manage their own proprietary strategies or to manage regulated investment funds offered to the public, each will have their own footprint on a market maker’s hedging trades.
Demand For Investment Vehicle Access to Options Strategies Is On A Positive Trajectory
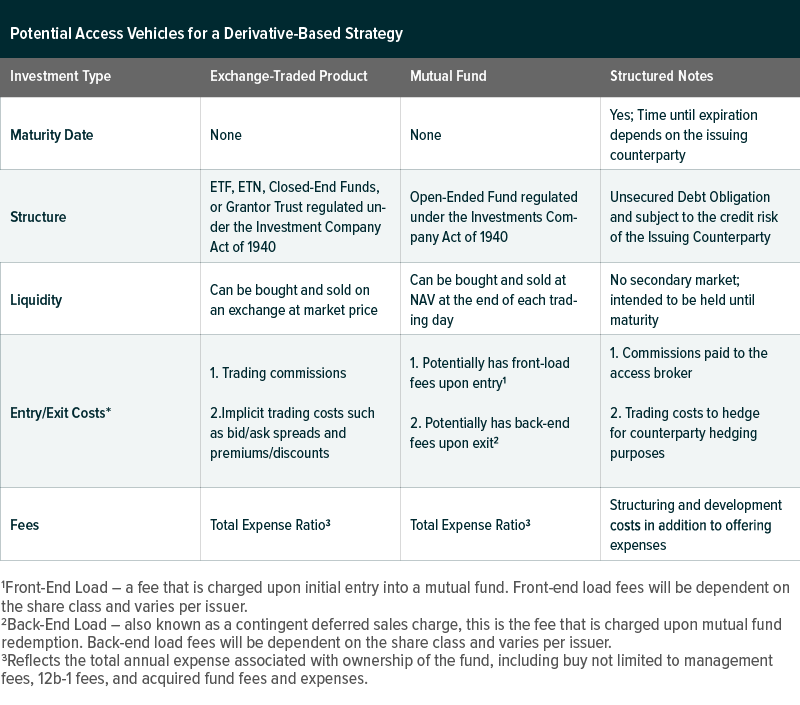
Today, investors have many access paths to implement options strategies. The most common, “do-it-yourself” (“DIY”) investors may implement their own customized options strategy on a particular asset or index. Another option may be to access an institutional-grade strategy through the usage of packaged products or investment funds, alleviating potential operational burden in implementing such a strategy by oneself.
Investment vehicles such as mutual funds, closed end funds in addition to structured notes (a type of structured product issued by a large bank) have a long history within this segment of the asset management industry. The structured note market overall saw $93B of investor come into these vehicles from 31,614 products within the U.S. markets over the course of 2022.1 However, ETF issuers have recently launched similar strategies, largely within the past 5 years, to provide investors another avenue of options market access.
Recently, the ETF wrapper has garnered the most interest relative to other investment fund structures. Generally, equity-based, derivative strategy ETFs in the U.S. markets obtain exposure to a particular basket of stocks, either passively or actively managed, in conjunction with an option overlay underpinned by assets or indices of similar characteristics to the stock portfolio. These systematized strategies may offer a level of predictability amidst potential macroeconomic fears.
Market Makers, ETFs, And Their Potential Impacts On Implied Volatility
Increasing the velocity of options trading, liquidity provider hedging flows help maintain a balanced backdrop for option market stability. However, this has also raised questions as to if these hedging flows, and equity fundamentals less so, are impacting equity market volatility.
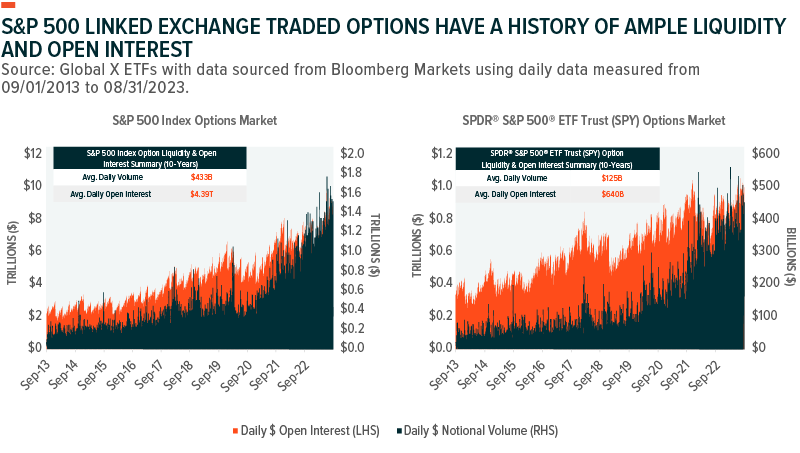
Amongst U.S.-listed, derivative-based ETFs, the S&P 500 has been the most popular index underpinning options used within these strategies. S&P 500 Index (SPX) options, options on S&P 500 tracking ETFs such as the SPDR® S&P 500® ETF Trust (SPY), or synthetically through the usage of equity linked structured notes have been the largest avenues of obtaining derivative exposure to this index. Currently, the combined assets under management (AUM) within these specific ETF options strategies encompasses 58% of all derivative-based, U.S. domiciled ETFs and signifies the market’s preference for broader U.S. equity exposures.2

However, the S&P 500 and SPY options market has a history of demonstrating ample liquidity and average open interest has increased significantly post-COVID 19 across both option types. The above data also discounts the fact that SPX or SPY option overlay strategies are implementing different strategies with differing notional exposure coverage ratios across contracts of differing strikes and expirations. Assuming notional exposures of their options overlays equal the AUM of each fund, this would assume that SPX-linked options overlay strategies are only accounting for roughly 1.17% of combined SPX and SPY daily average open interest.
As notated earlier, mutual funds, closed end funds, and structured products may also be implementing similar strategies. However, ETFs offer daily transparency with higher levels of insight into their portfolio footprint. This may also another reason as to why ETF demand for such exposures are increasing. As the popularity of the options-based ETFs increases and fund sizes increase, market markers may use multiple access vehicles to hedge their exposures from index-tracking ETFs and their corresponding options markets as well as the futures market.
Conclusion
Investment strategies implementing derivative-based overlays have demonstrated significant growth over the last few years, particularly within the ETF wrapper. With daily transparency, ETF access has been an important tool for investors as they seek to access strategies from simplistic to the most complex to diversify portfolio exposures. Options dealers are significant contributors to this growth as these types of strategies tend to be systematic in nature when it comes to the rolling schedules of their underlying options holdings. As options markets expand across popular large and small-cap indices, these liquidity providers have many types of hedging vehicles in their quiver as a means to conduct their hedging activities while keeping spreads tight.