Inflection Points – March 2023: Beneficiaries of Innovation Beyond Big Tech

Editor’s Note: Inflection Points is a monthly series intended to explore the underlying trends, dynamics and opportunities shaping the thematic investing landscape. Click here to receive future updates via email.
A major sea change is underway as the benefits of investing in innovation are democratized across the economy. For the past decade, big tech yielded disproportionate returns from innovation.1 The big tech companies, defined here as Meta Platforms, Microsoft, Amazon, Apple, Netflix, and Google (MMAANG), were toll takers for the internet, and they reinvested their windfall cash flow to sustain technological leadership. But after a decade of maintaining higher returns on invested capital and growth in capital expenditure, the benefits of innovation are spreading to more players, which should be positive for the economy overall.2 A broader base of winners from technology adoption could propel market gains and the next generation of growth companies even as big tech’s leadership softens.
Key Takeaways
- Large cap tech firms captured much of the returns from innovation over the last decade, but that trend has started to shift as productivity-enhancing technology becomes more ubiquitous.
- Companies seem to have learned that investing in innovation is a strategic imperative, and they are yielding greater rewards as capital expenditure (capex) increases rapidly.
- Certain areas of thematic growth potentially offer a way of capturing returns from a broader set of companies involved in the next wave of innovation while helping reduce big tech concentration.
Beyond the Decade of Big Tech Domination
Big tech may well be the most remarkable profit-producing machines in the history of capitalism. Through a combination of investment, innovation, intense competition, and a bit of happenstance, these companies dominated the last decade. Their business models focused on monetizing end users through a diverse revenue mix drawn from product sales, memberships, subscriptions, and advertising.3 These models resulted in network effects where the value of a product increases with the number of users.4 The telephone is a prime example.
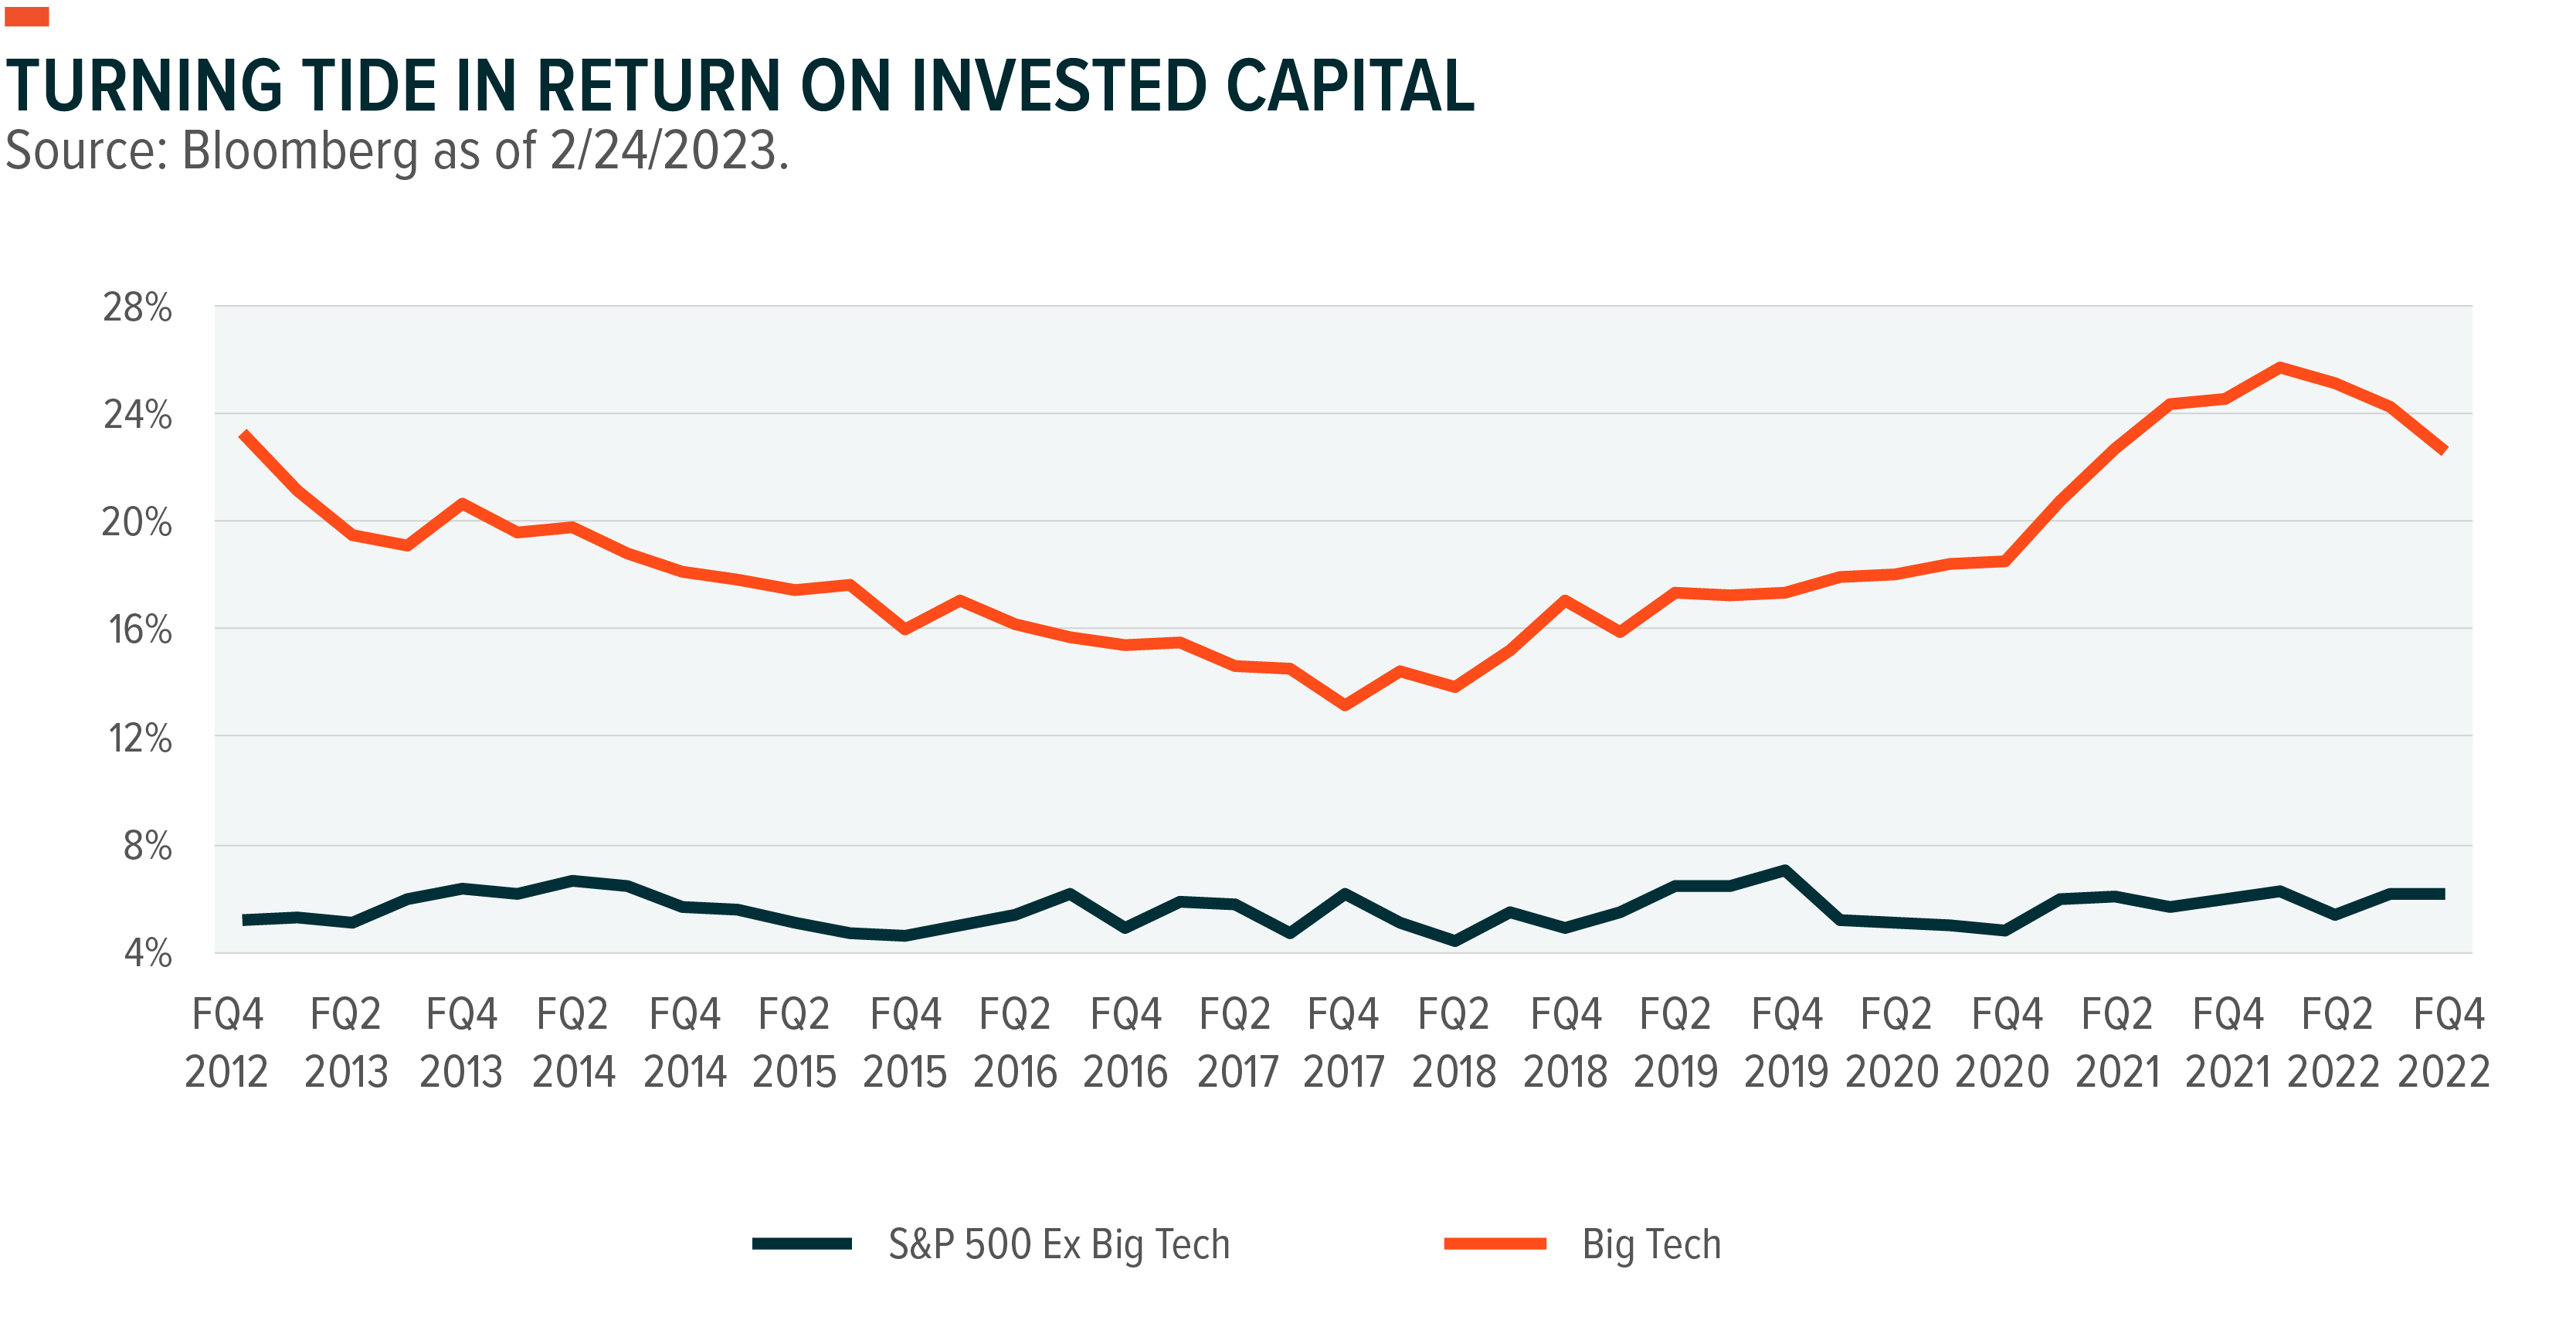
How dominant was big tech? Over the last 10 years, big tech’s returns on invested capital (ROIC) was almost triple that of the other 494 companies in the S&P 500 Index (see chart).5 Those excess returns over the broader S&P 500 were successfully reinvested, generating excess returns for shareholders. The market value of the big tech firms grew at almost 19% annually, compared to the broader S&P 500 at just shy of 10%.6
That dominance, however, is starting to fray. ROIC for the six big tech firms has been in decline since 2020, while that of the S&P 494’s increased. The differential remains meaningful, but the gap is narrowing.
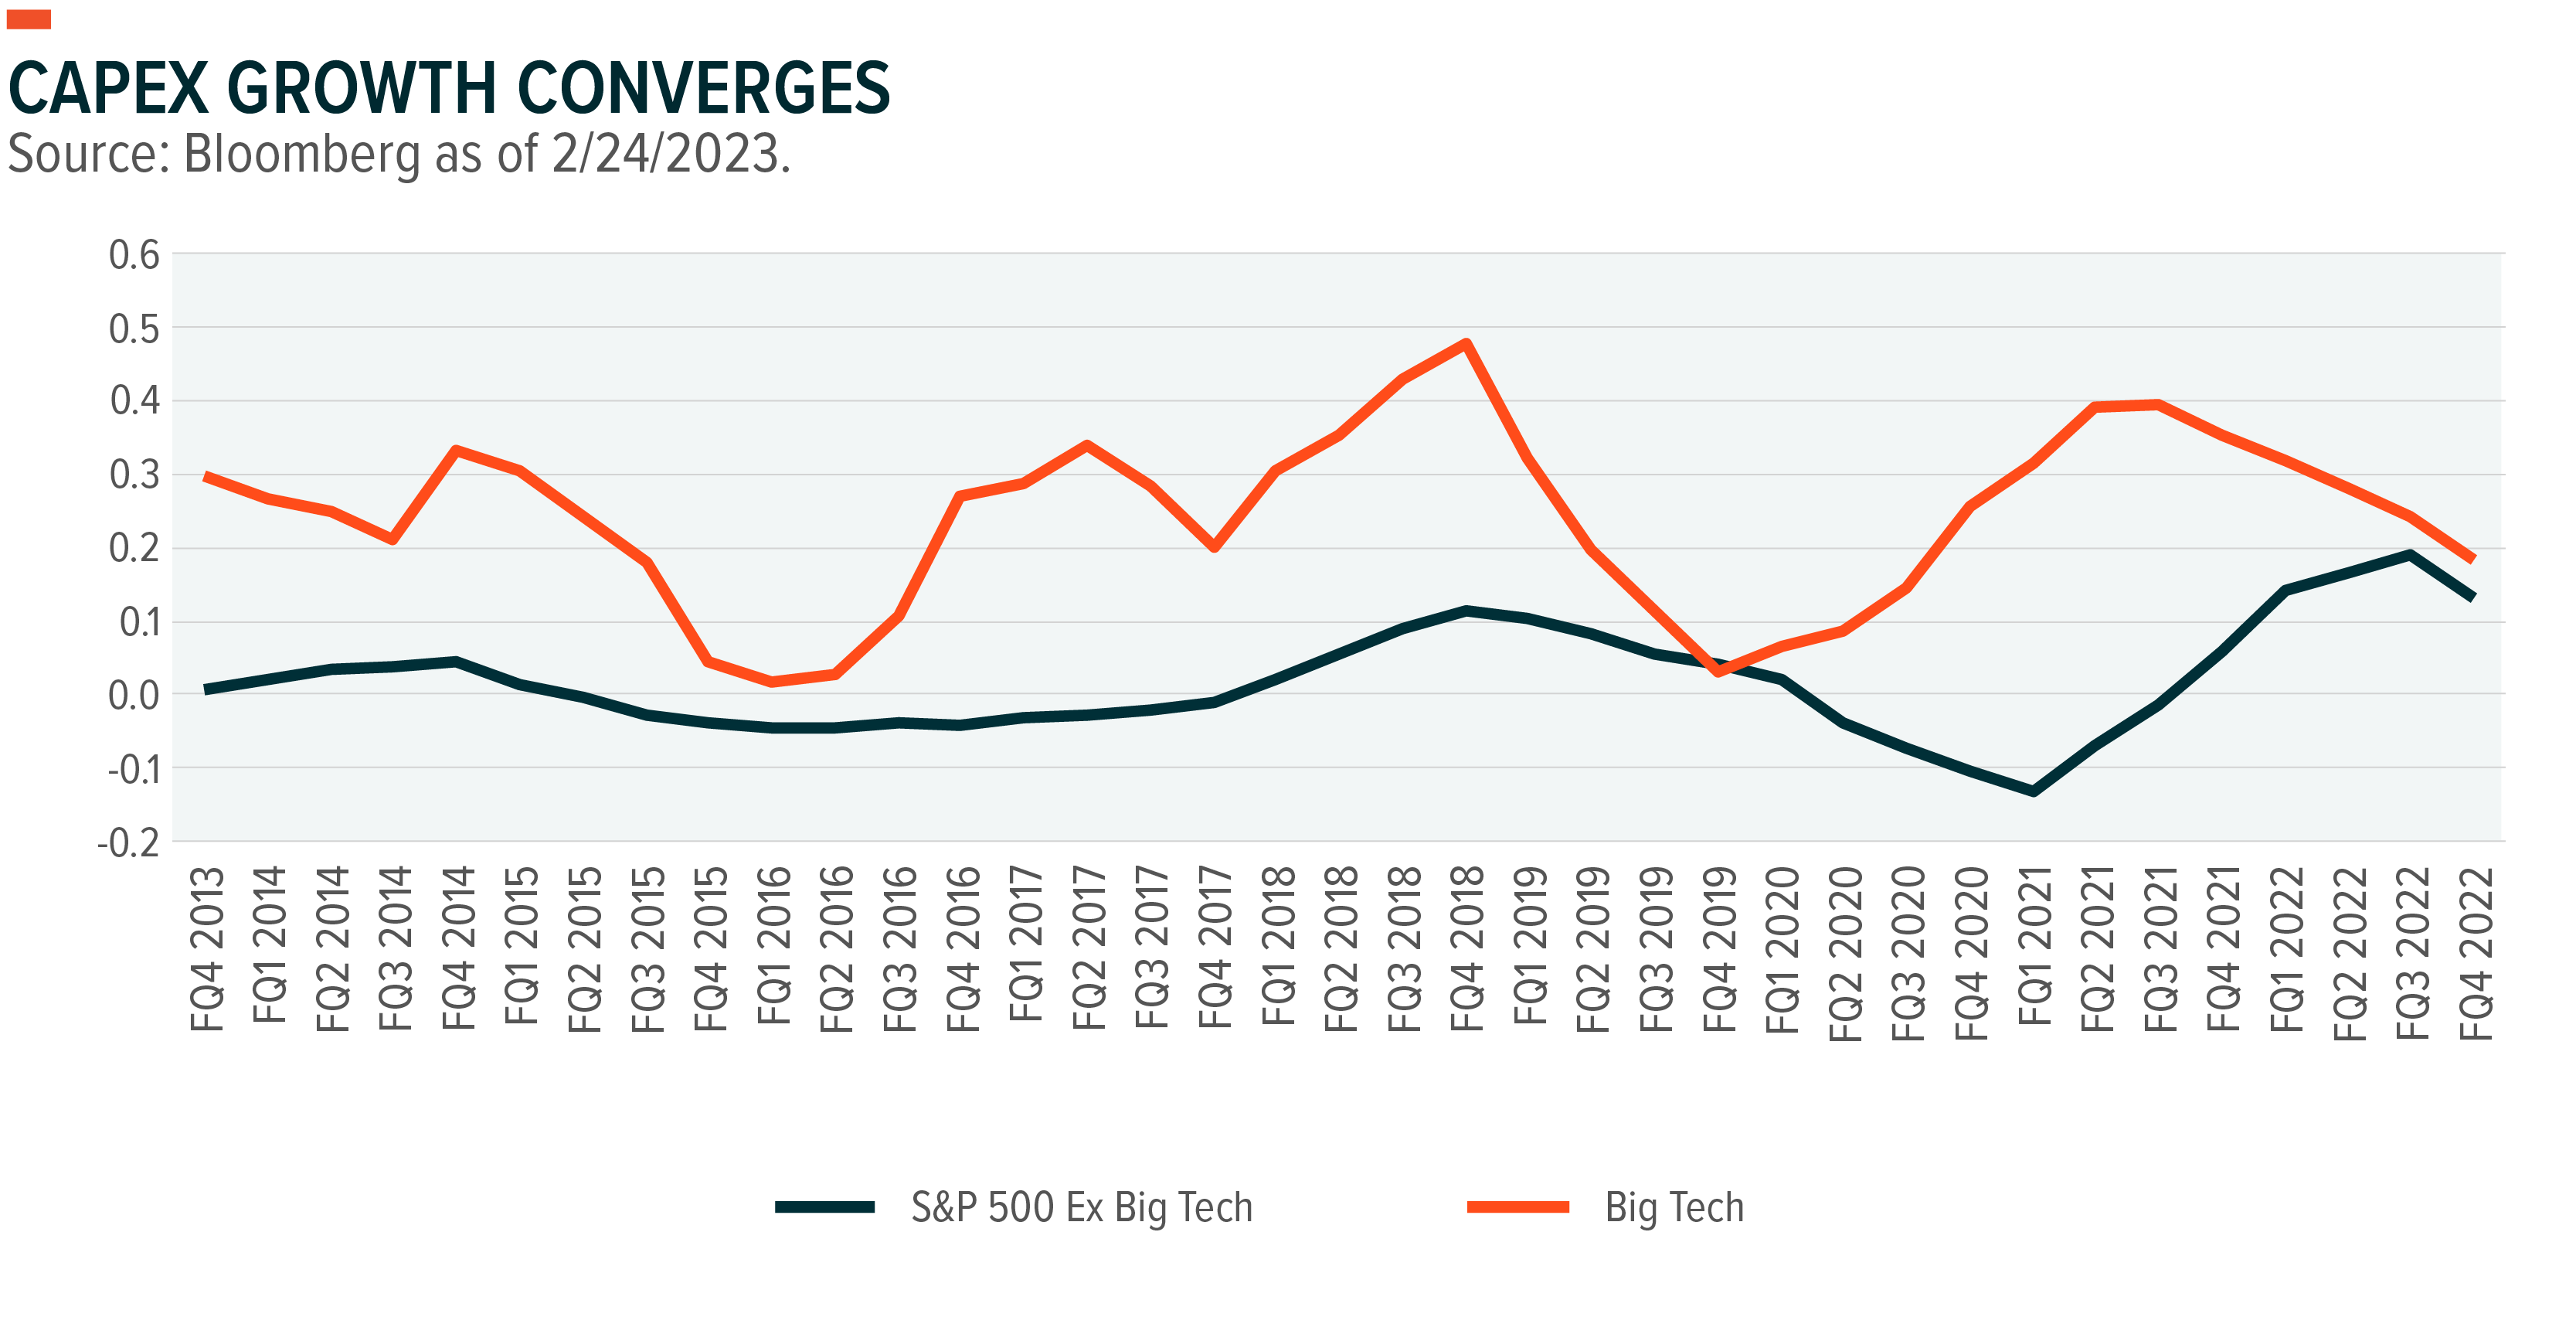
The S&P 494 lagged big tech in reinvestment over the past decade, but that trend is also shifting. Big tech’s average annual capex growth was above 30%, well above the S&P 494’s average growth near 2%.7 That gap started closing during the pandemic and continued to close through the economy’s reopening (see chart). The S&P 494 grew capex relatively rapidly during this period, while big tech slowed spending amid concerns over margins and pulled forward growth. By Q4 2022, S&P 494 capex spending growth was 13% year-over-year, compared to big tech at 18%.8
Old World Companies Embrace New World Tech
Two spending trends are notable. First, many companies increased their capital expenditure during the pandemic to onboard new capabilities like productivity tools, cloud infrastructure, and automation.9 Those investments helped firms sustain margins as costs of labor and materials rose, passing only half of producer price increases along to consumers.10 Potentially even more powerful, companies continued increasing capex despite negative GDP growth in early 2022 and the slowing earnings growth expected in 2023.11
Non-tech companies embrace of new technologies to deliver innovative products and improve their processes crosses industries. Agricultural and construction equipment company Deere & Co., for example, made significant strides in automating tractors for harvesting, integrating drones for crop dusting, and developing a network of satellites to facilitate information sharing.12 Emerson Electric started manufacturing AC motors used in electric fans in 1890, and today the company provides industrial products that integrate sensors and software for industrial automation.13 A new standard for leading consumer appliance companies like Samsung and Whirlpool is integration of sensors and software into ovens and washing machines that can be synched with mobile phones.14
There are numerous examples of process innovation such as traditional retailers use of mobile apps and payment systems to create a seamless customer experience. They also leverage emerging technologies like virtual reality for employee training.15 The real estate, furniture retail, and factory design industries benefit from digital 3D models.16 Delivery companies increasingly rely on advanced algorithms to improve throughput with existing resources.17
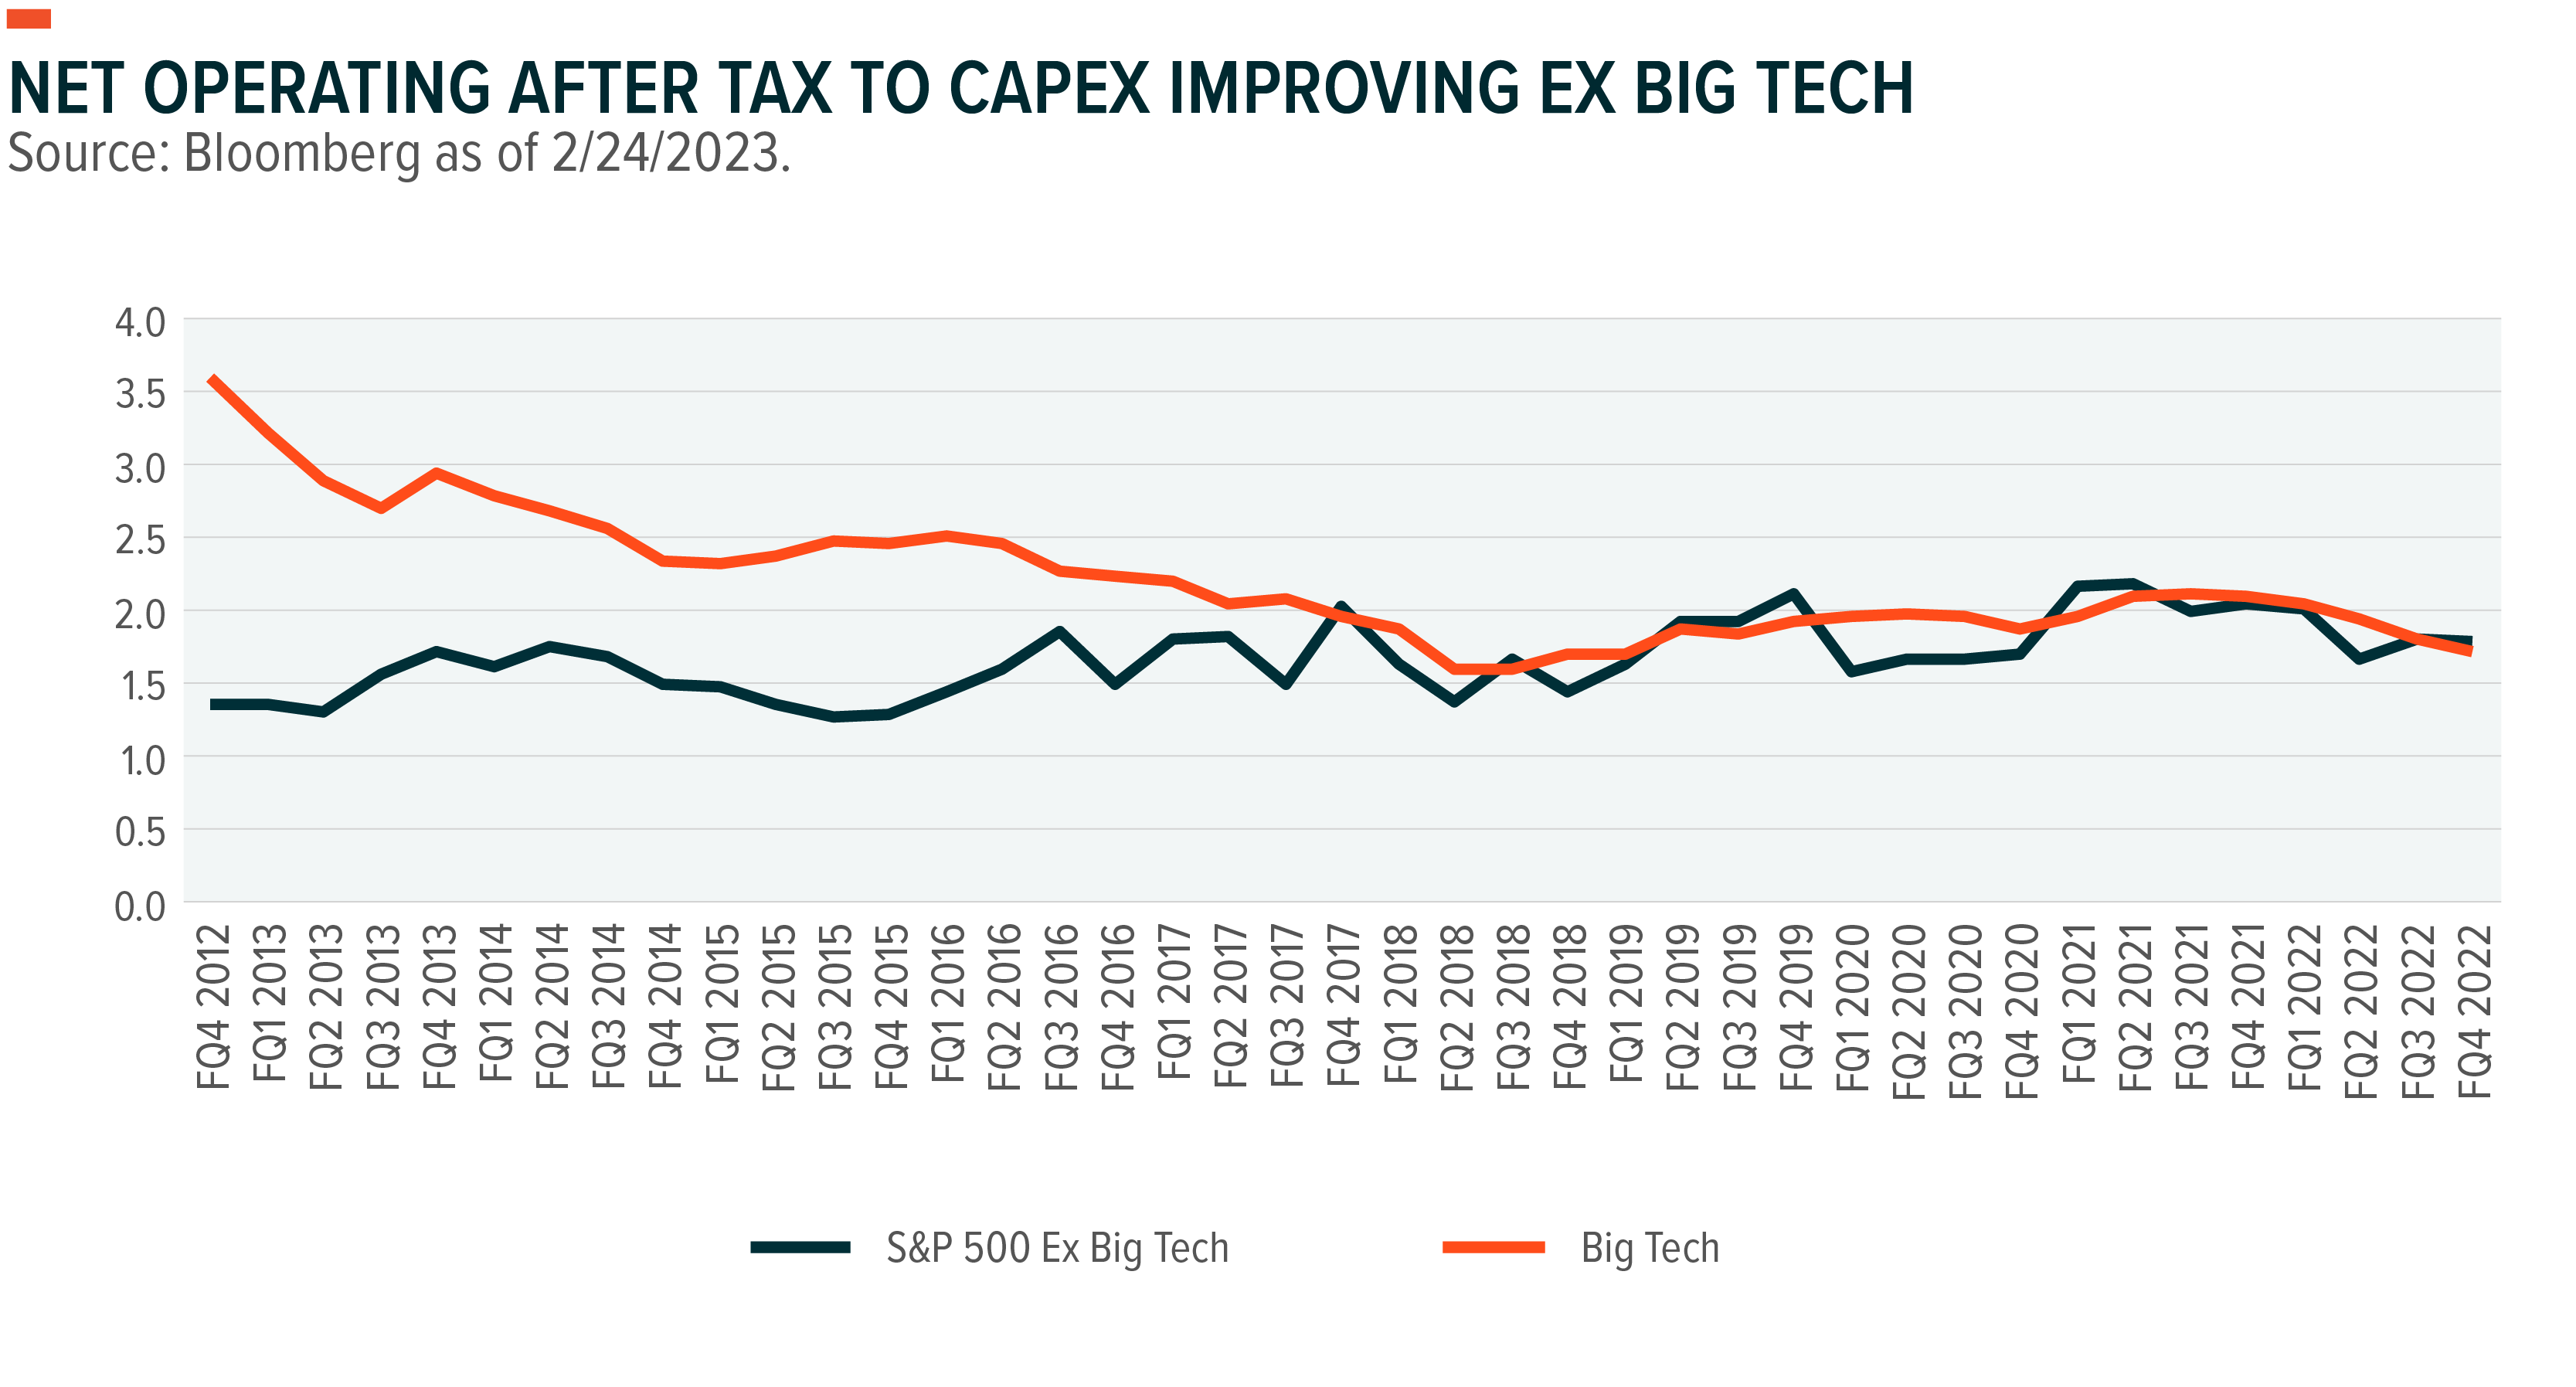
Embracing productivity-enhancing tools is good business. The S&P 494 now generates higher net operating profit after tax (NOPAT) per dollar of capital expenditure than big tech (see chart).18 Ten years ago, big tech generated almost $4 of NOPAT per $1 of capital investment, but by Q4 2022 that was down to $1.71. During that period, the S&P 494 gradually improved from $1.48 of NOPAT per $1 of capital investment to almost $1.80.19 This helps explain why companies beyond big tech have grown their capex more aggressively. They are enjoying a bigger piece of a growing pie.
Positioning for Diffusion of Returns from Innovation
A growing base of corporate investment is good for the economy, and as that grows, investors may want to look at ways that innovation creates new opportunities beyond the big tech names that won the last decade. Thematic options as opposed to some growth indexes may offer greater diversification while still providing exposure to innovative and critical economic segments. Many growth indexes like the Nasdaq 100 and Russell 1000 Growth have significant concentrations in big tech, which would further concentrate investors with exposure to a broad index like the S&P 500 (see chart).20
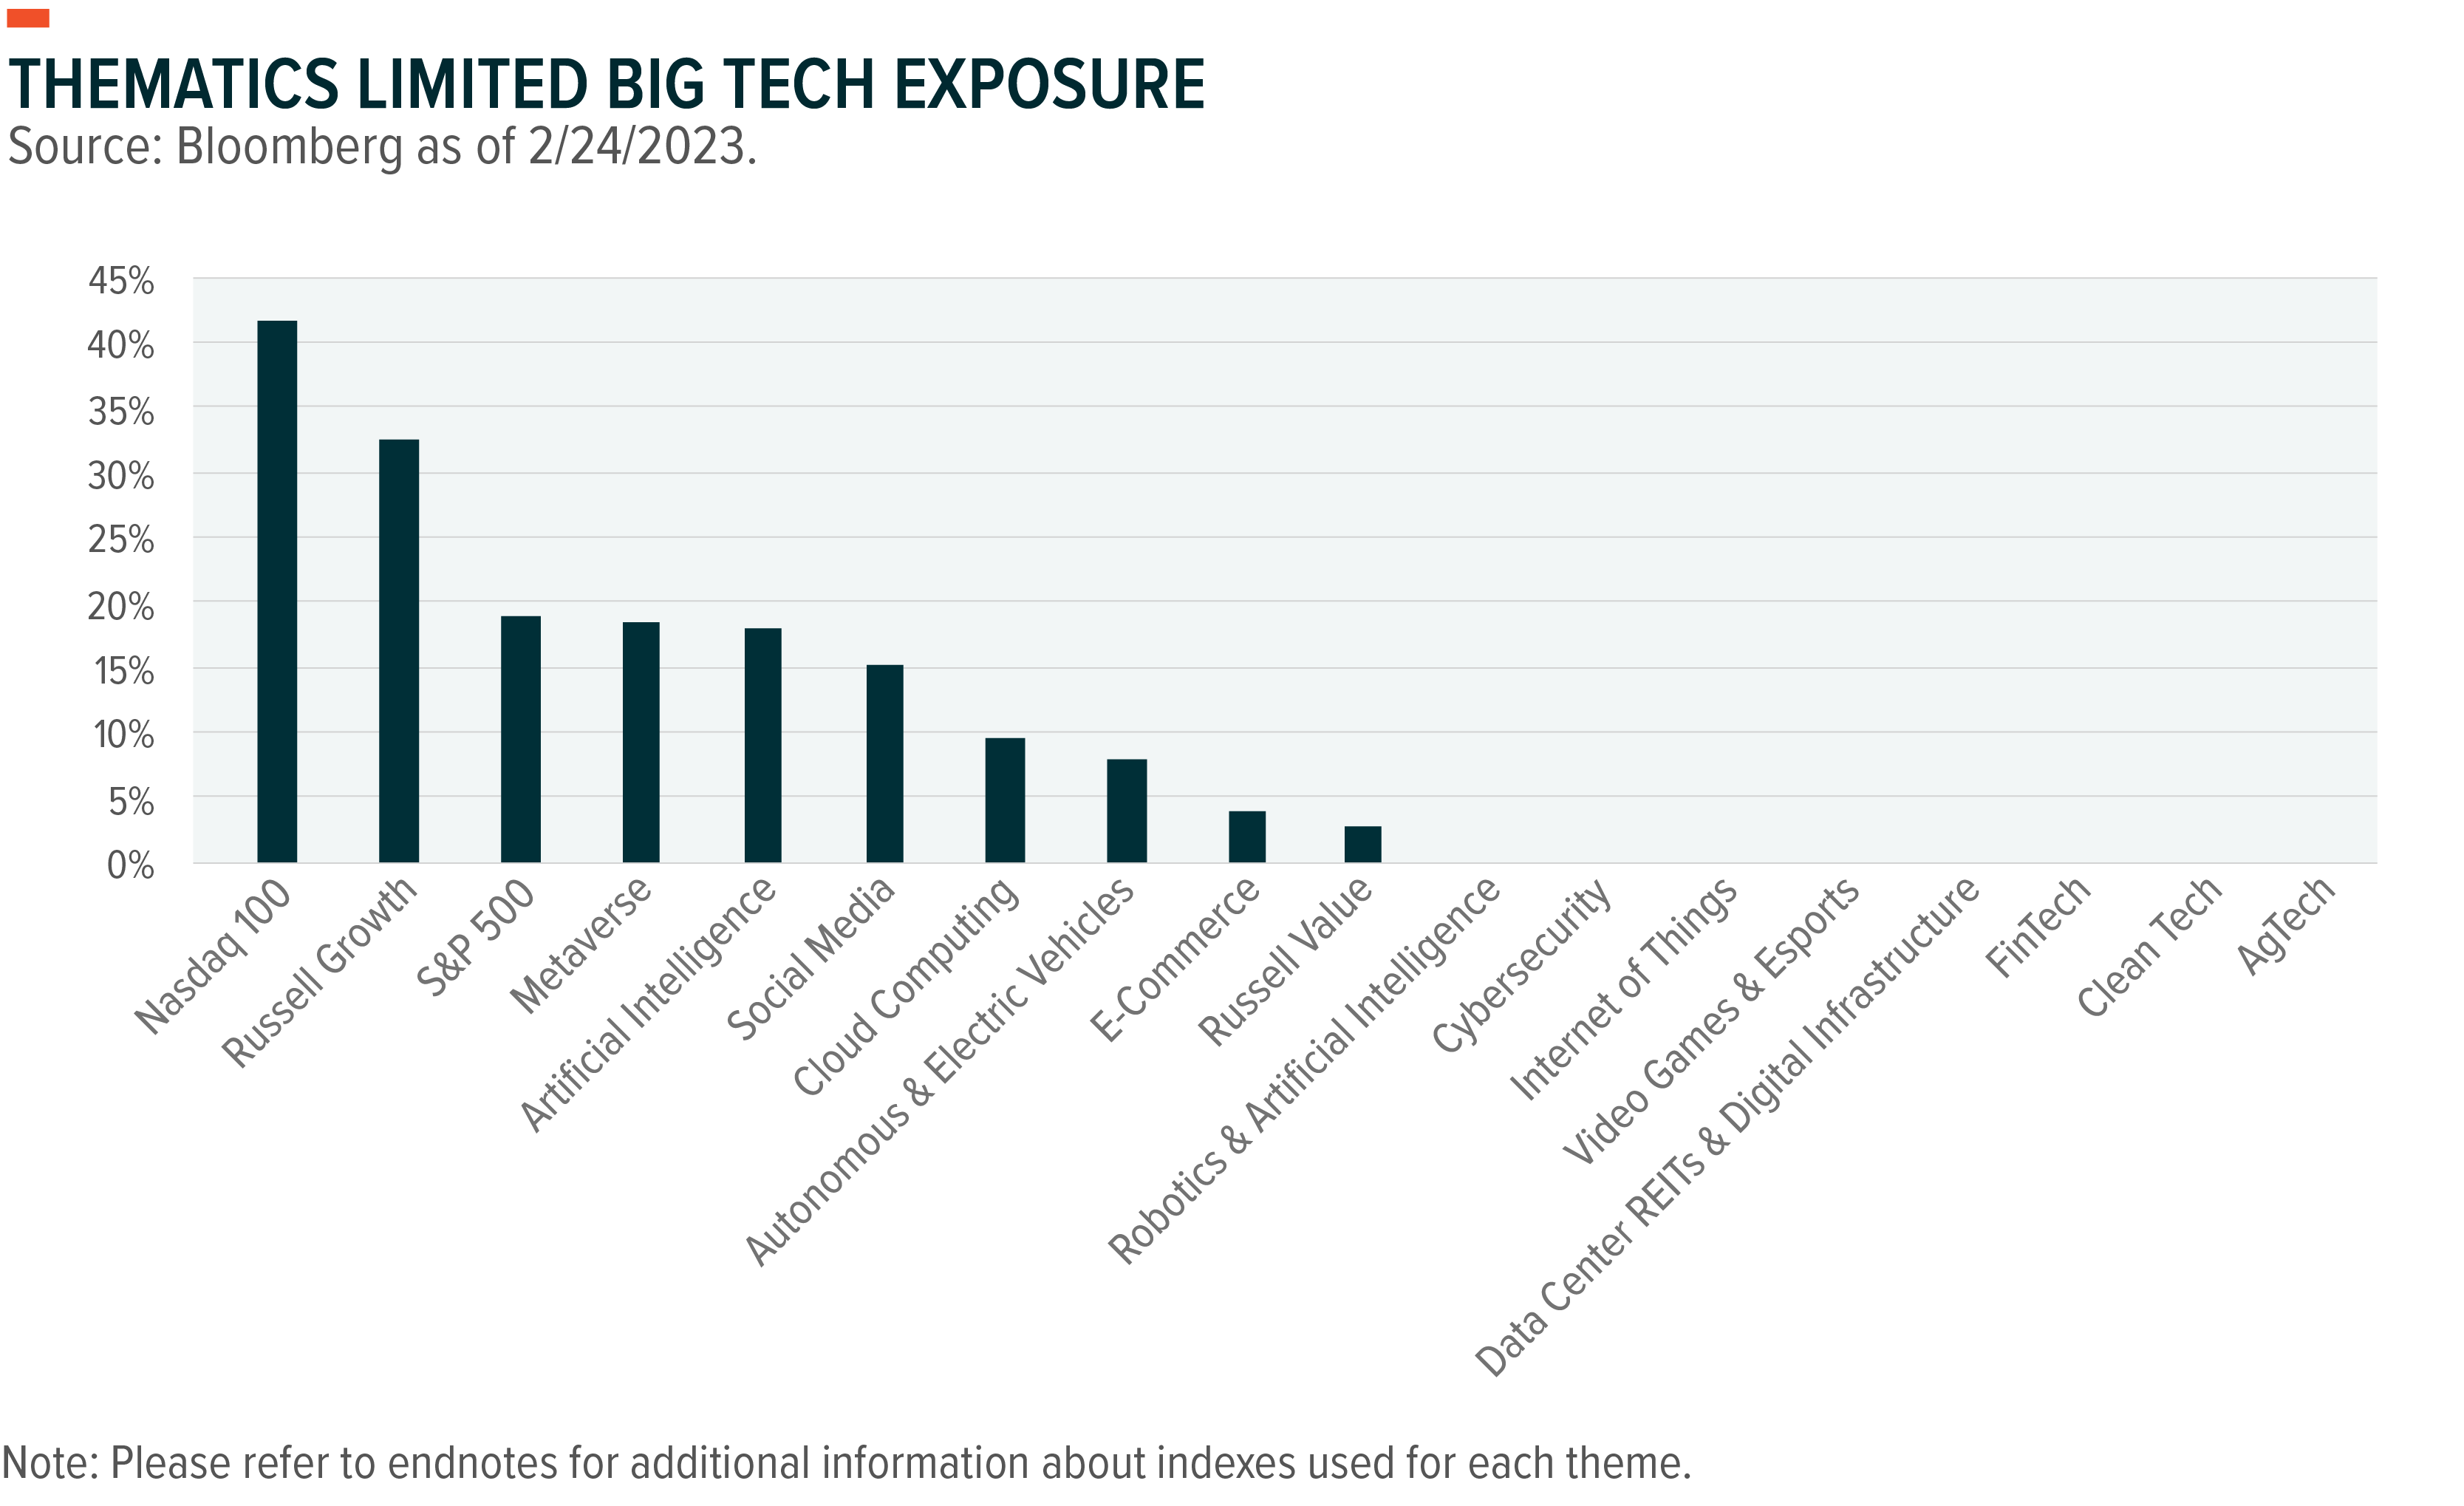
Thematic opportunities in exciting areas like Robotics and Artificial Intelligence, Cybersecurity, Internet of Things, Clean Technology, and U.S. Infrastructure have relatively low big tech allocations. These themes can allow investors to reduce big tech exposure while also providing access to hotbeds of future economic innovation.
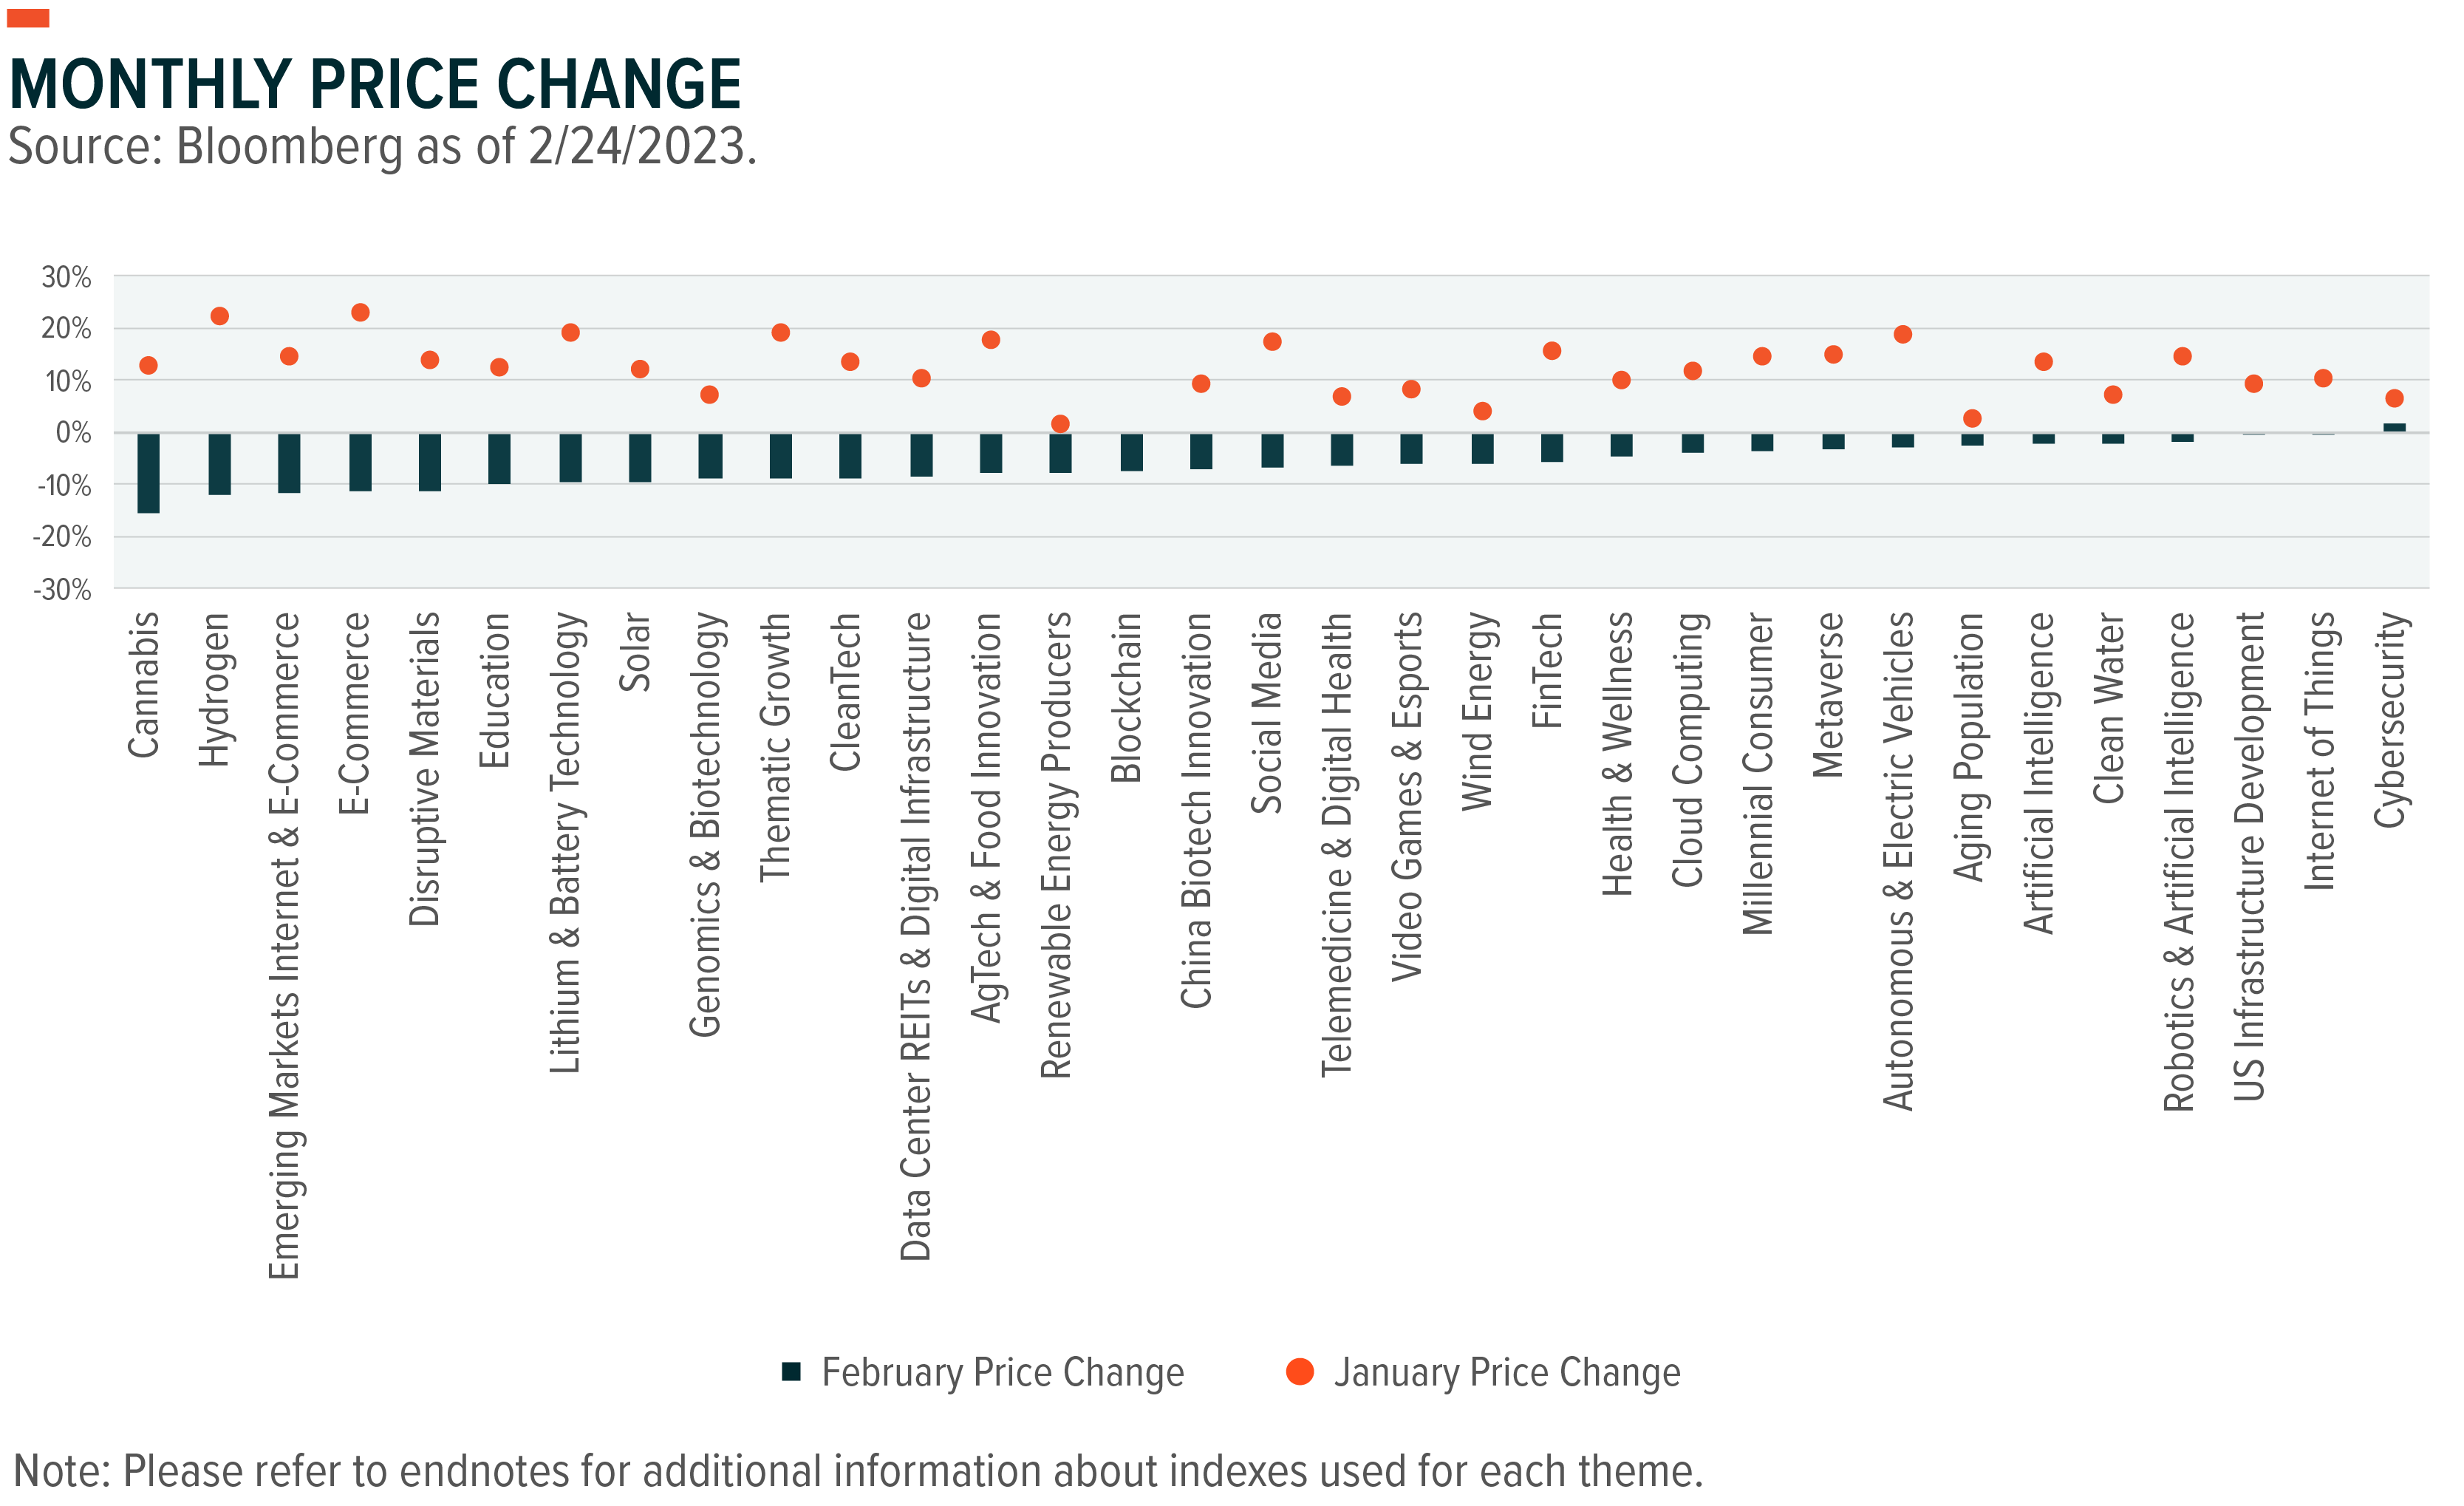
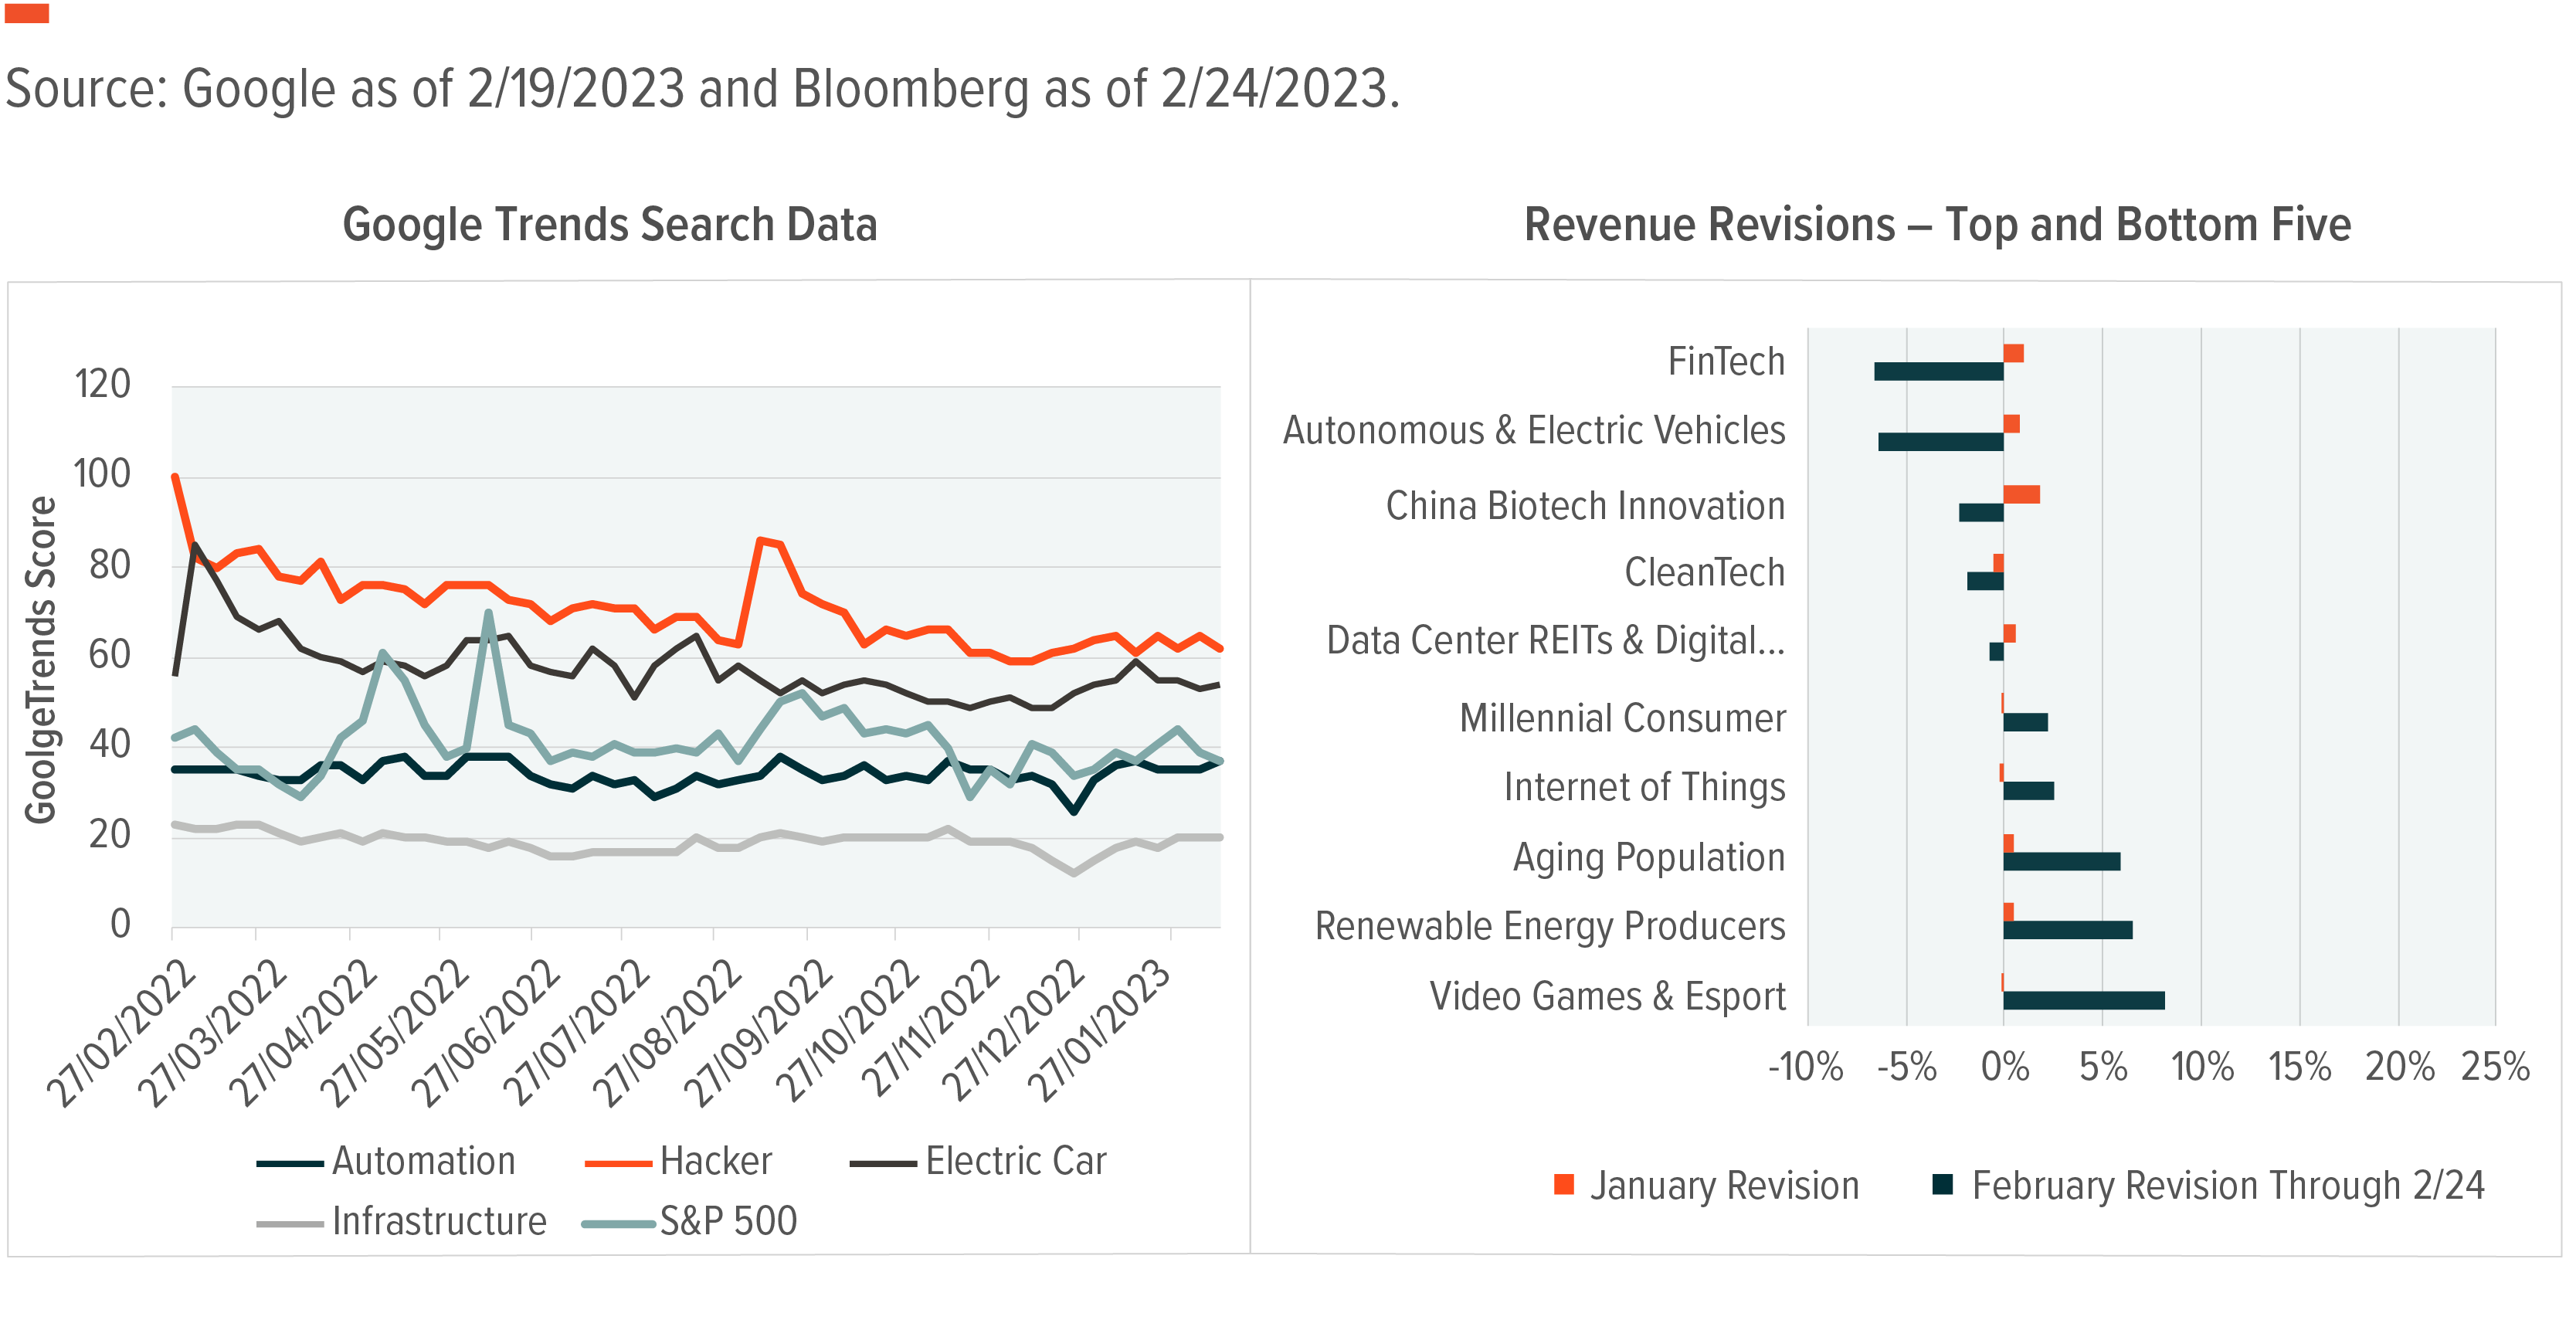
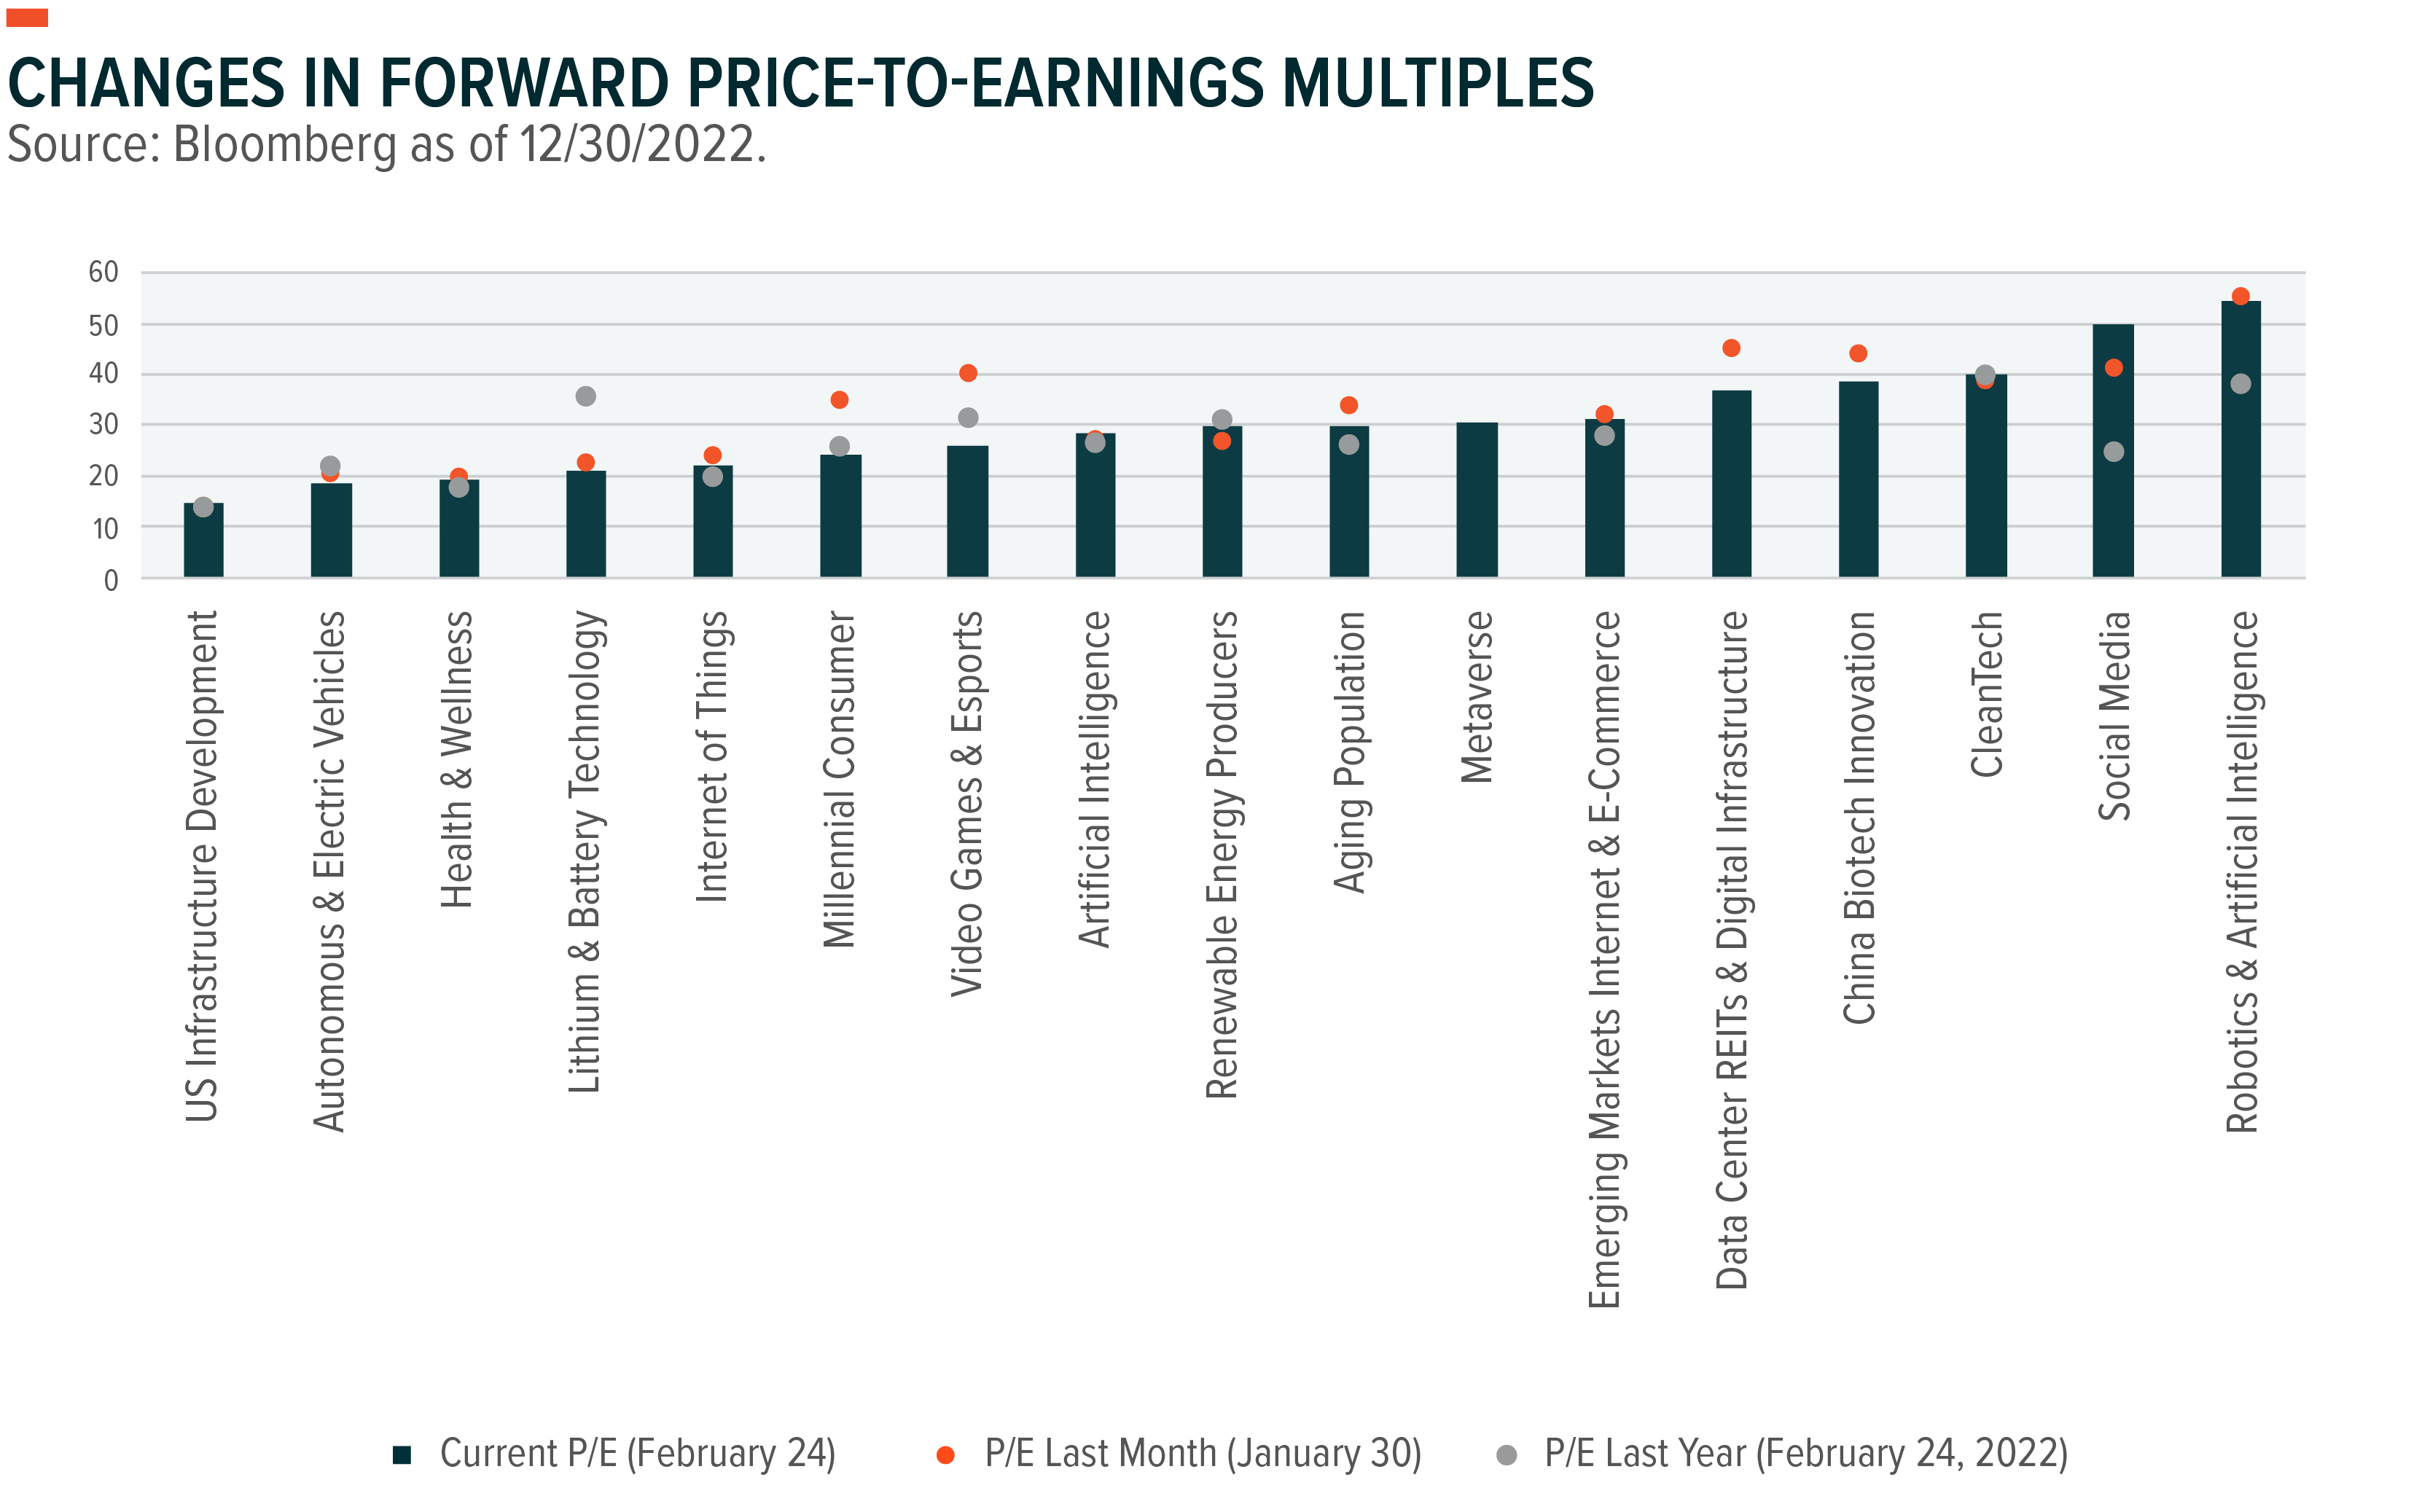
Inflection Point Theme Dashboard